Time Graph Component
A Time Graph component tracks and displays the live values for the selected channels.
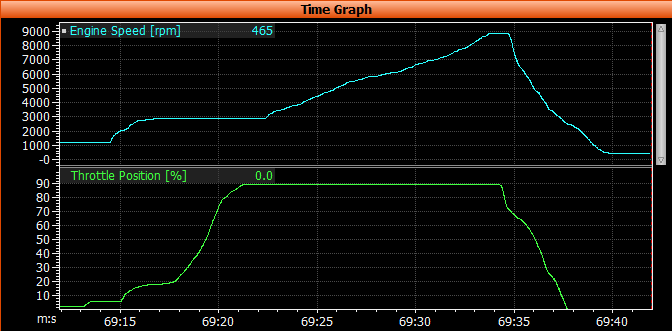
The graph uses time as the X axis, and the individual channel range for each channel group on the Y axis.
It is possible to pause and restart the time graph using keystroke A , see Live Data Control for more details.
The Time Graph Properties window controls the following:
- The caption of the component
- Add and remove channel groups and channels to display
- The order of channel groups and channels
- The layout of channels
- Various display options such as axis information, ranges and units
- The period of time shown in the graph and other telemetry options