Scatter Plot Component
The Scatter Plot component is a live updated component that is used to show a trend of two related channels on a plot.
A common use of this sort of chart is to plot the relationship between the boost channel and RPM, or to show how the oil pressure changes with oil temperature.
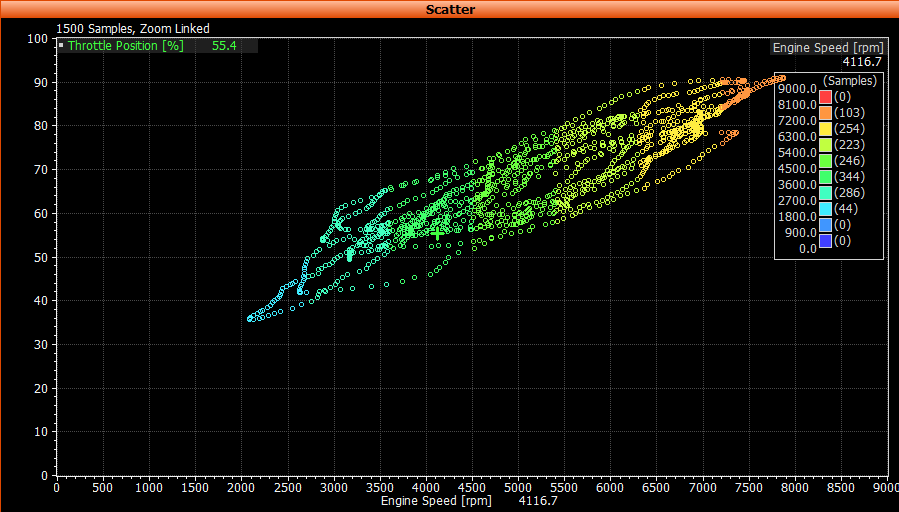
The Scatter Plot samples the two selected channels at 50 Hz, and plots the intersection between the two channel values on the chart. Each plotted value will stay displayed on the screen for a configurable length of time.
The Scatter Plot Properties window controls the following:
- Channel selection and settings
- Various display options
- The period of time the plot is displayed (via the Telemetry tab).