Colour Graph Component
The Colour Graph component shows a coloured representation of a channel over time.
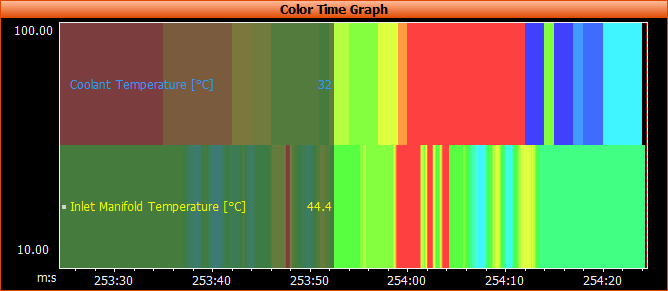
The example below shows an engine temperature colour graph where the engine starts up cold, warms up, cools down and so on.
This type of graph is useful when comparing multiple exhaust temperatures, for example. If all cylinders are displayed on this graph at once, a visual representation is given showing how each cylinder is climbing in temperature compared with the other cylinders.
The Colour Graph Properties window controls the following:
- Channel selection and settings
- Various display options
- The speed of the time line (via the Telemetry tab).