Histogram Component
The Histogram component provides a graphical representation of the proportion of time that a channel has been within a specific value range. For example, the amount of time that an engine has spent in high boost.
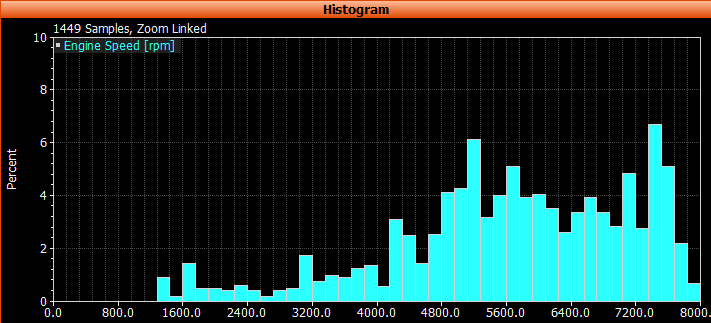
A common histogram shows the amount of time that an engine has spent at particular RPM ranges, as shown in this example histogram.
The Histogram Properties window controls the following:
- Channel selection and settings
- Various display options
- The period of time (via the Telemetry tab).