Status
The Status view shows status grids for all diagnostic channels found in the firmware.
The Status view is automatically organised into groups, Groups that contain more than 4 items will receive their own tab along the top of screen. Items that are not in a group will be seen in the Misc tab.
Select F3 to bring up the Status view or click on the Status tab of the Side Bar Navigation.
Note: Some channels/status grids may be hidden when their subsystems are set to Not in
use.
Clicking on any of the Status grids will raise this diagnostic channel in the time graph at the bottom of the Status view. The time graph provides a view of the behaviour of that diagnostic channel historically during the power cycle.
Select  to bring
up the Show Status Event Log dialog.
to bring
up the Show Status Event Log dialog.
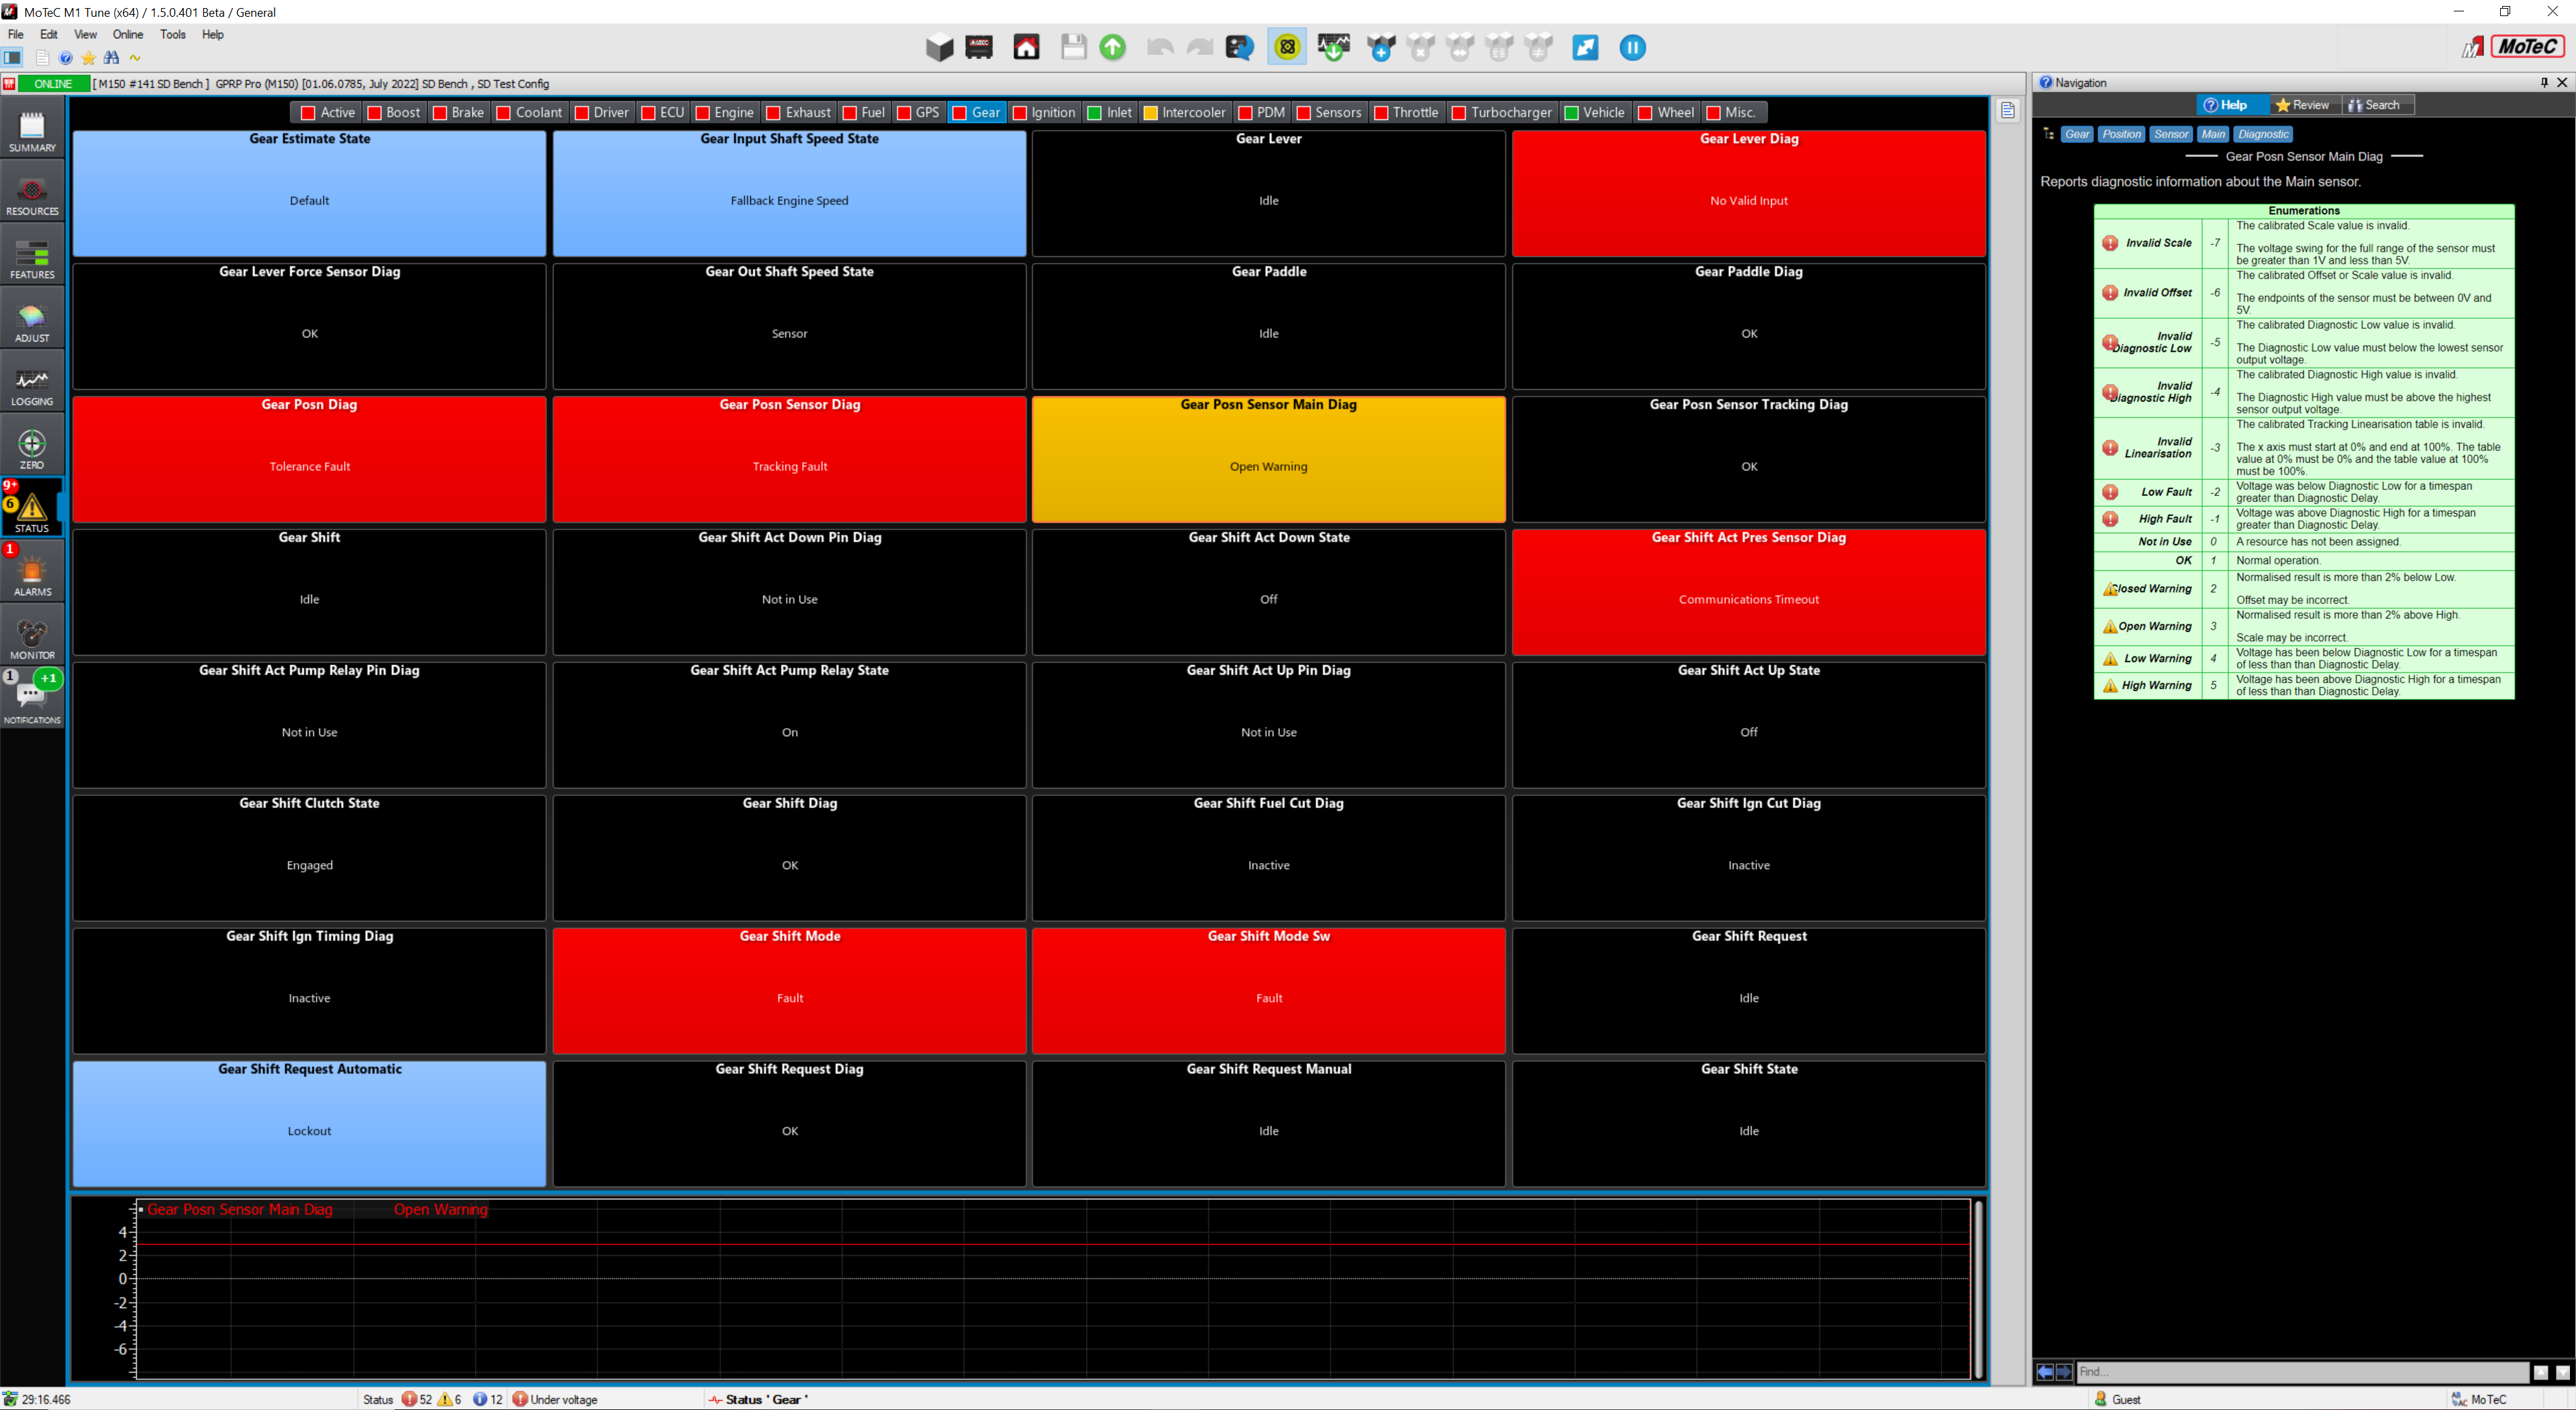
The image below shows the Gear group has been selected:
- Gear Posn Sensor Main Diag has been selected (Orange highlight).
- The Gear Posn Sensor Main Diag channel is shown in the time graph.
- F1 has been selected to bring up the help. The help shows the enumerations and the faults associated.